How to debug Playwright-based (Robot Framework Browser) robots in Visual Studio Code
How to develop and debug Playwright-based robots in Visual Studio Code using Robocorp Code extension.
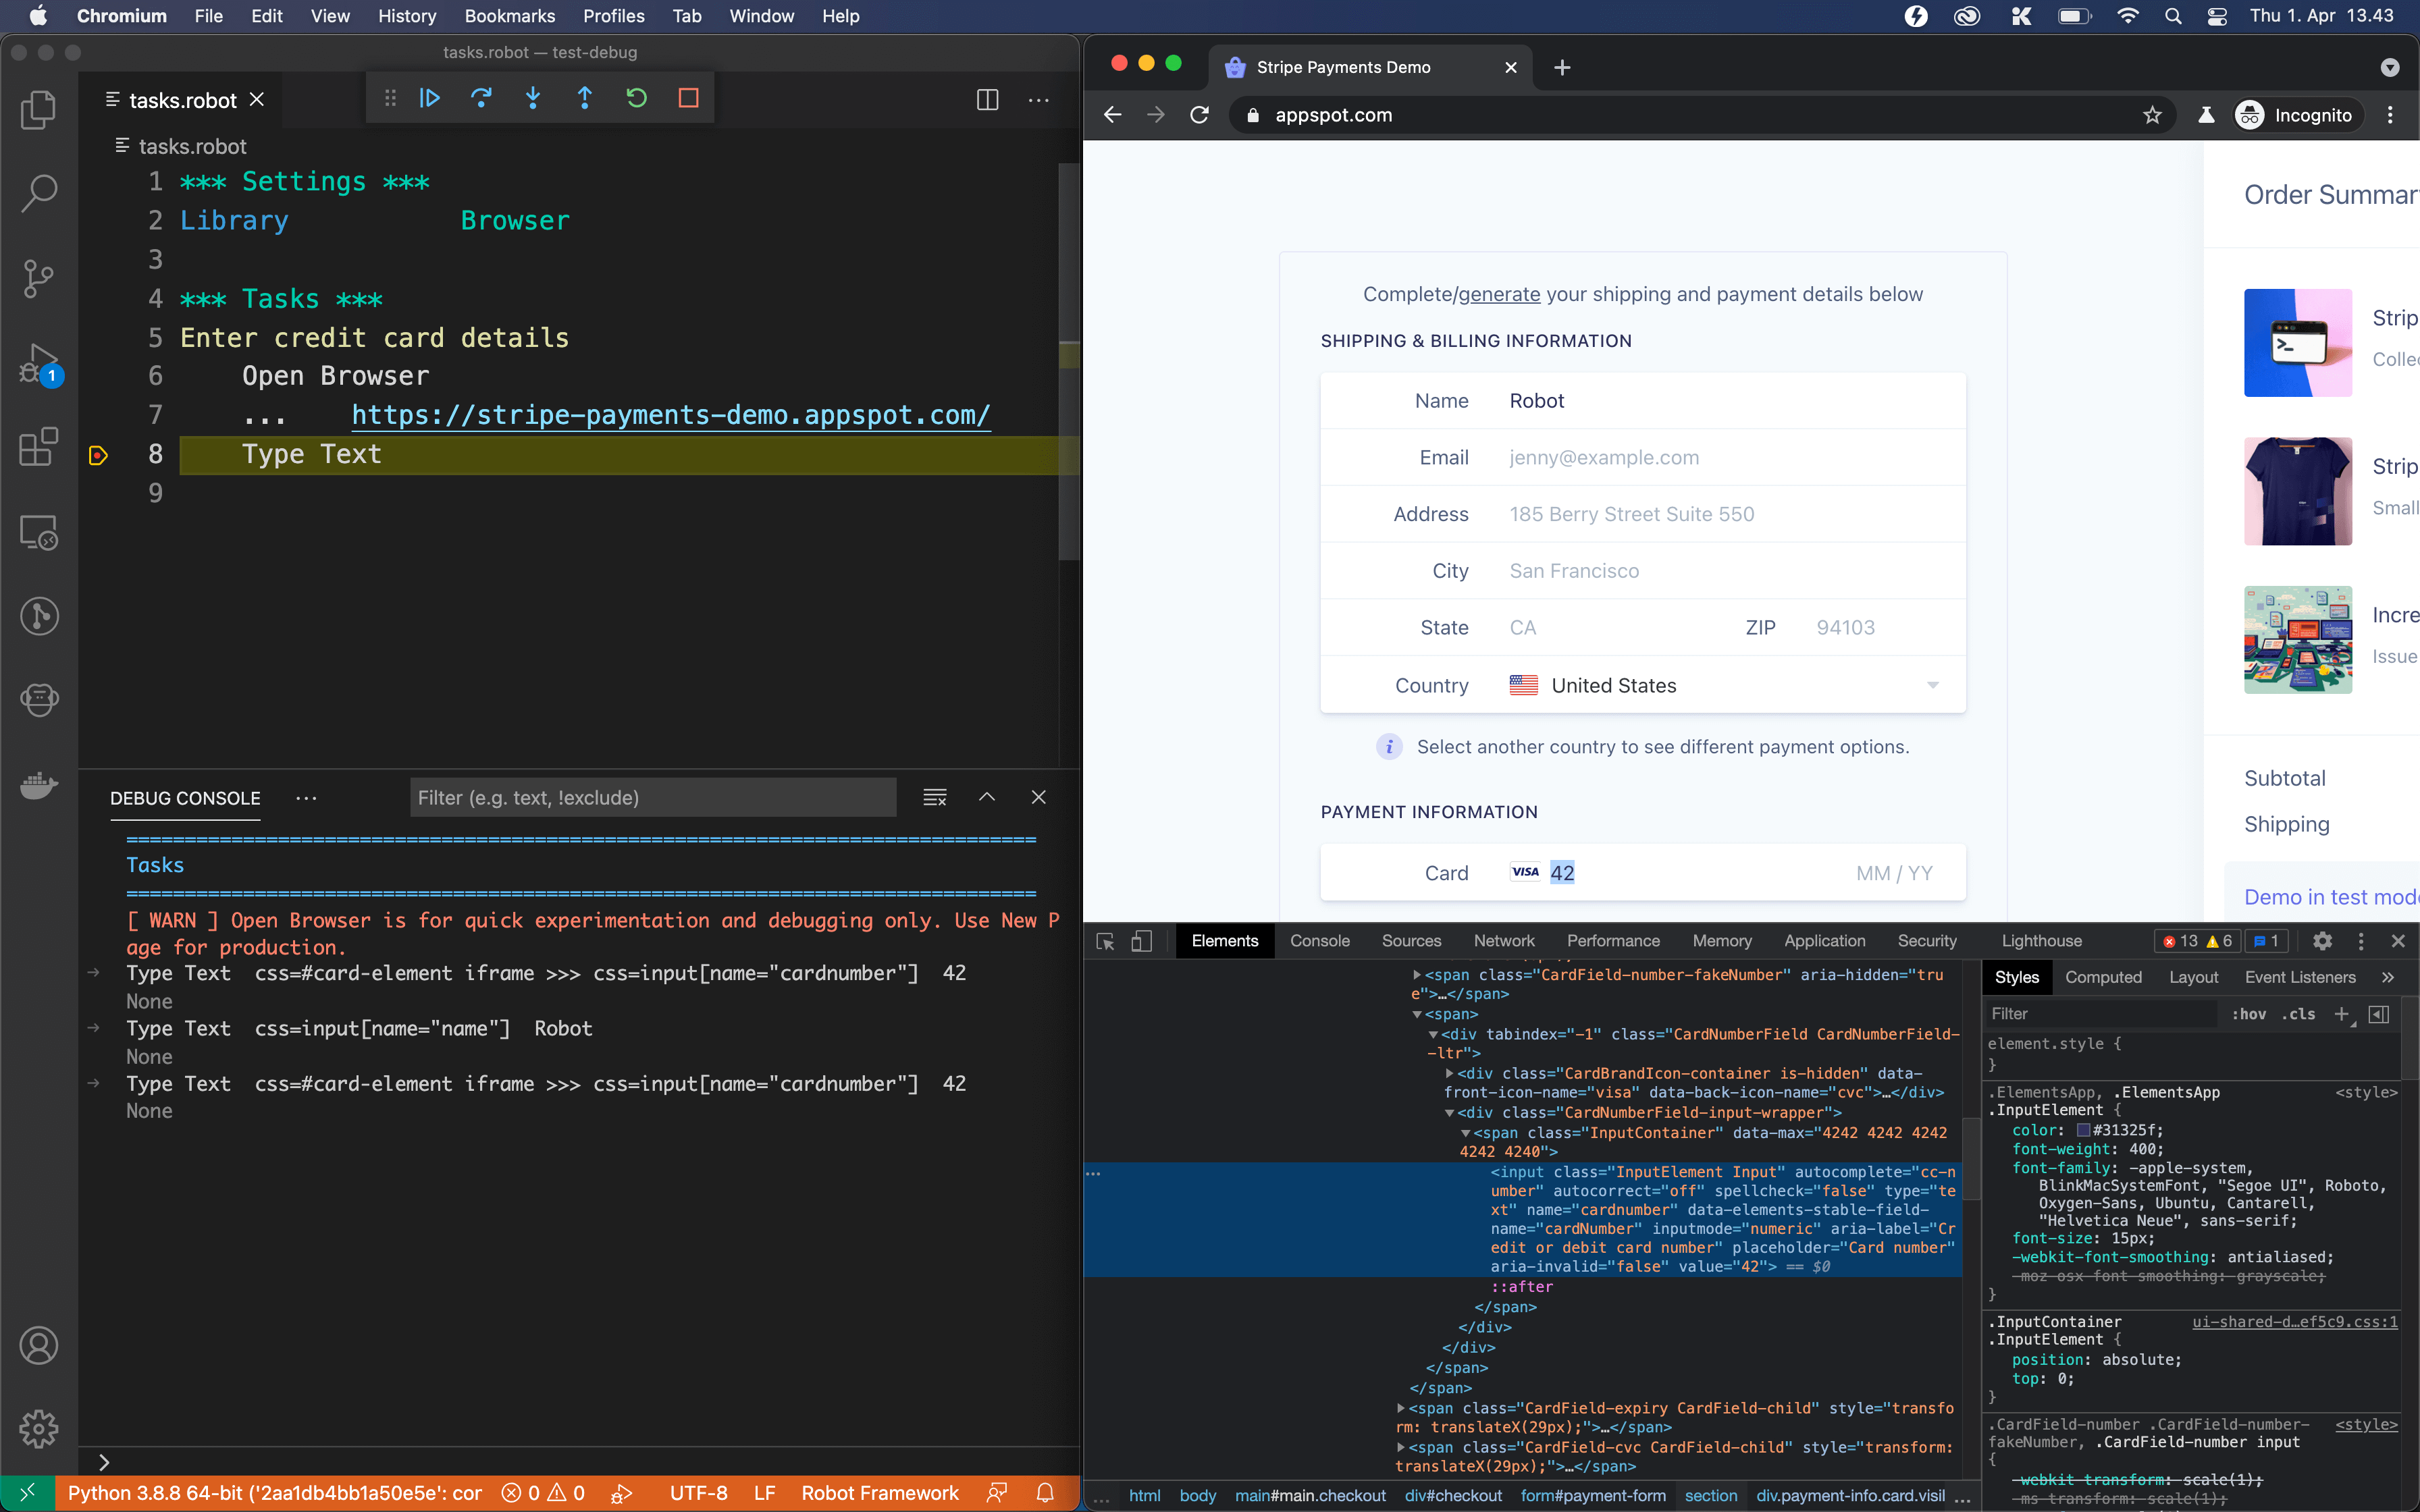
Debugging Stripe Payments Demo form in Visual Studio Code
Robocorp Code Visual Studio extension provides a way to debug Playwright-based (Robot Framework Browser) robots. Debugging is useful for trying out element selectors and experimenting with keywords.
Let's use Stripe Payments Demo as our target application and the debugger tools in Visual Studio Code to find selectors for our Playwright-based browser robot.
Install the Playwright-based Robot Framework Browser library
Use the following conda.yaml file to import the required dependencies and run the initialisation command to use the Playwright-based Robot Framework Browser library:
See Installation with Robocorp for more information about the dependencies.
The robot file
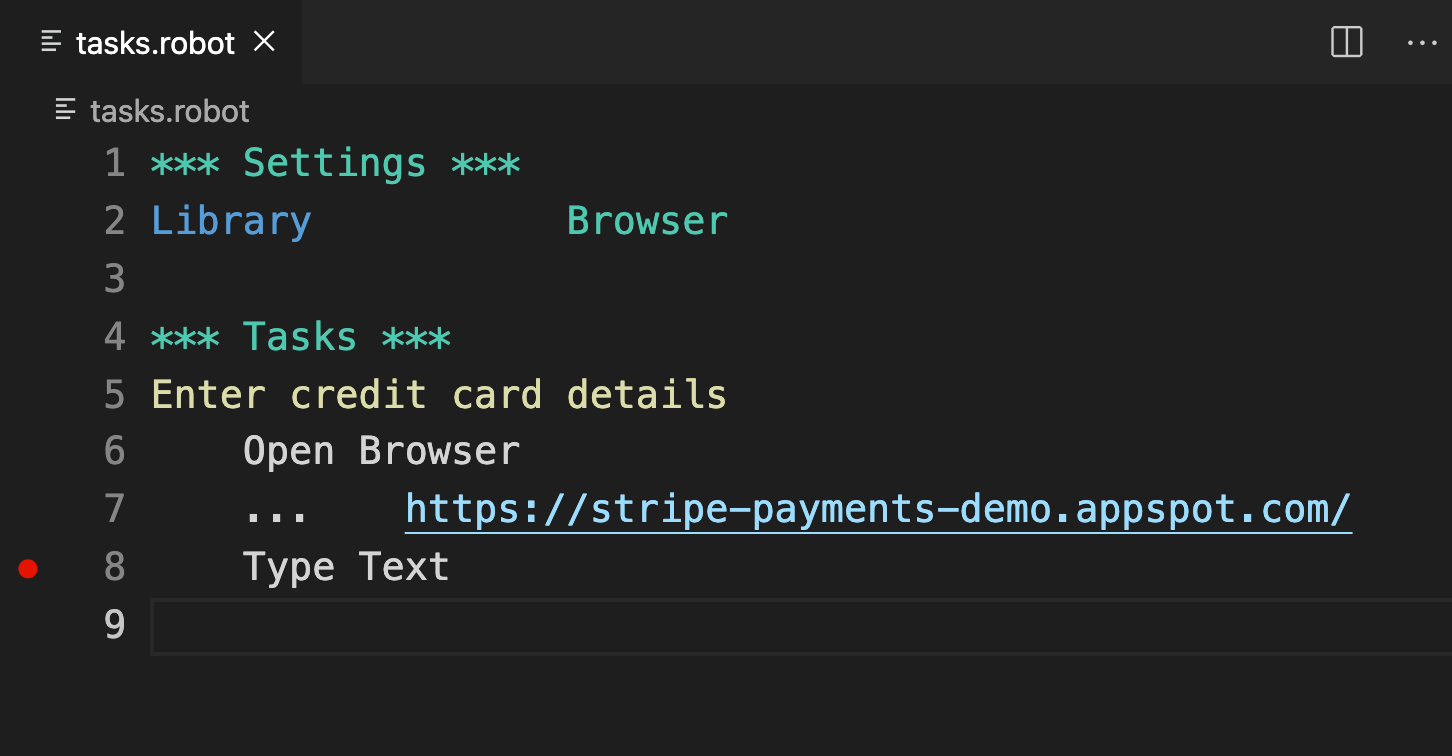
Use the following tasks.robot file:
The robot imports the Playwright-based RPA.Browser.Playwright library.
The Open Browser keyword is useful when debugging robots, as it launches the browser in a non-headless mode (you can see the browser user interface). The https://stripe-payments-demo.appspot.com/ URL points to the Stripe Payments Demo form.
The line with the Type Text keyword call will be used in setting up a breakpoint to stop execution.
The
Open Browserkeyword is meant for debug purposes. Use theNew Pagekeyword in production robots.
Set up a breakpoint to stop execution
Click on the left gutter on the line with the Type Text keyword to set a breakpoint (shown as a red dot):
Run the robot in debug mode to use breakpoints
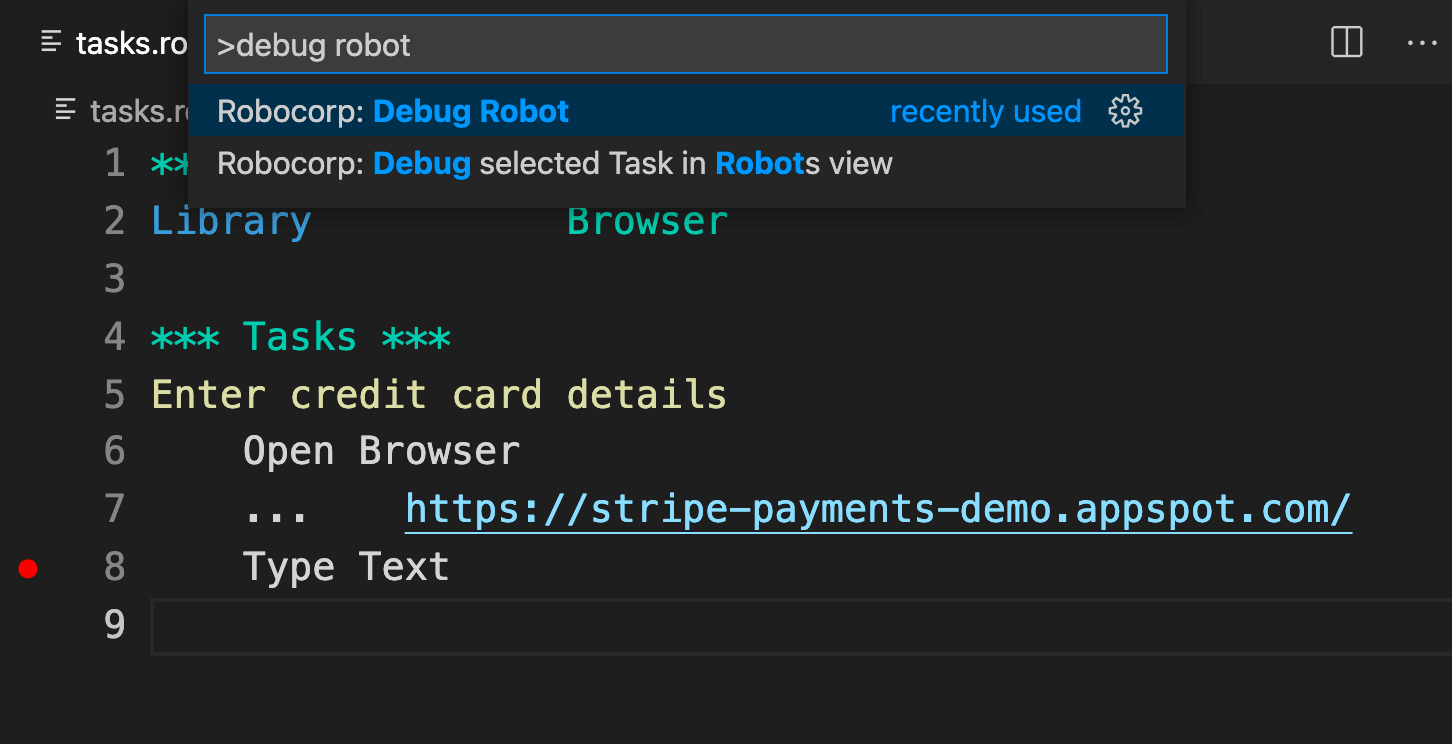
Press Shift-Cmd-P (Shift+Ctrl+P) to open the command palette. Select the Robocorp: Debug Robot option:
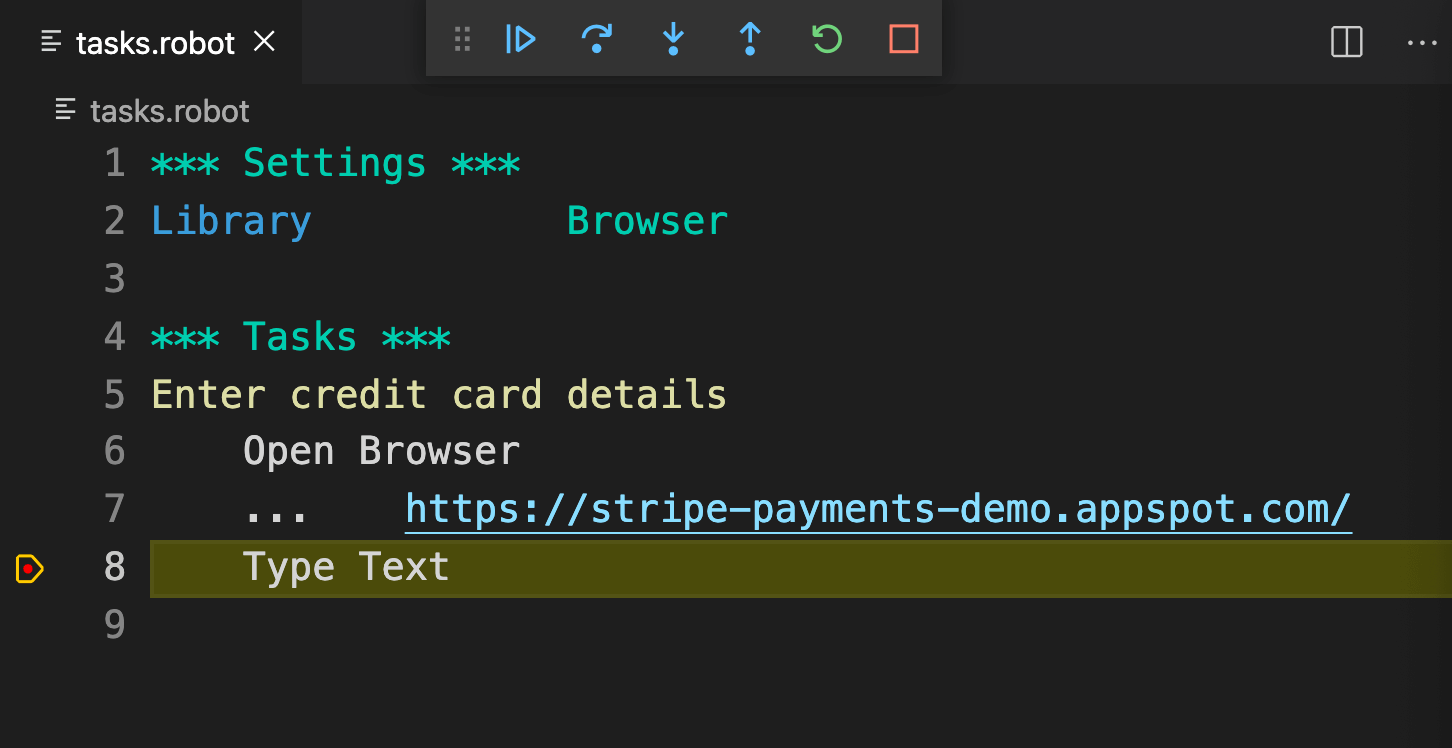
The browser will open, and the execution will stop at the breakpoint:
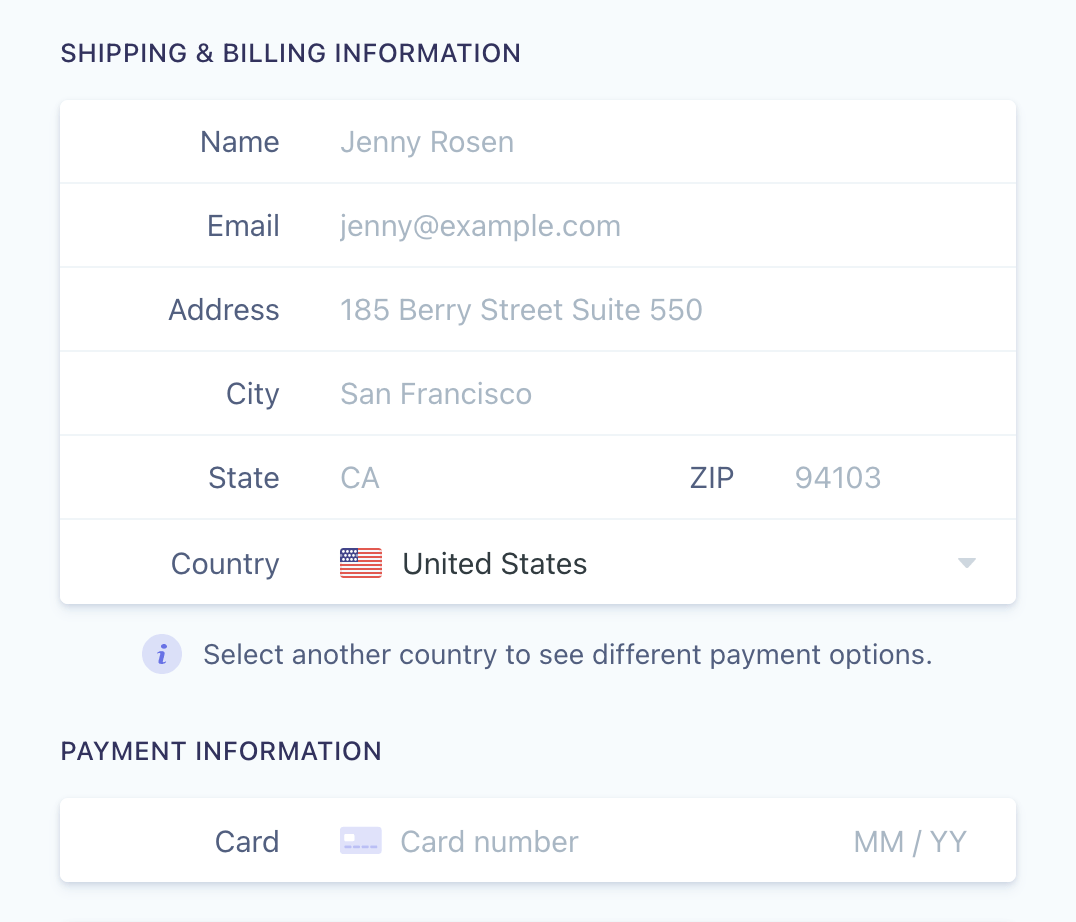
The Stripe Payments Demo form
The robot opened the Stripe Payments Demo form:
The debug console
At the very bottom of the Visual Studio Code interface, you will see a debug console waiting for commands:

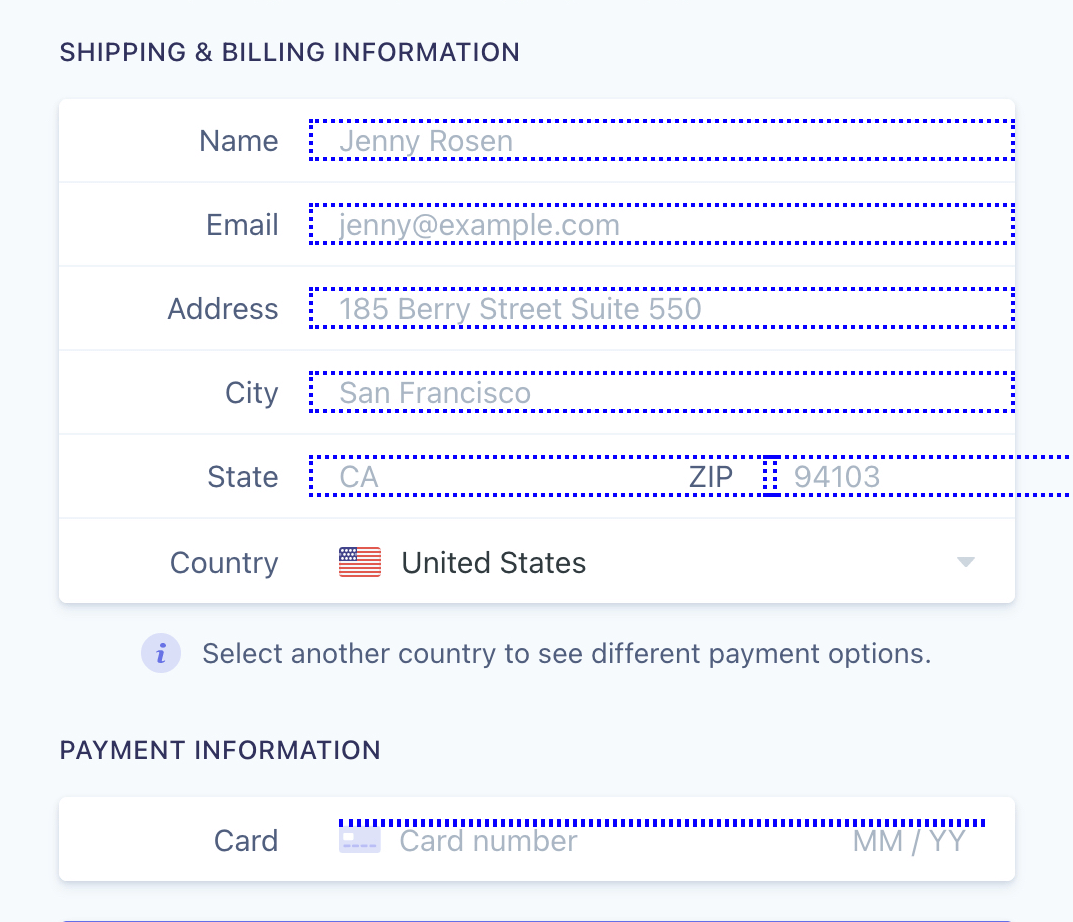
Use the Highlight Elements keyword to highlight inputs
Type the following keyword call in the debug console and press Enter:
The input elements will be highlighted on the form:
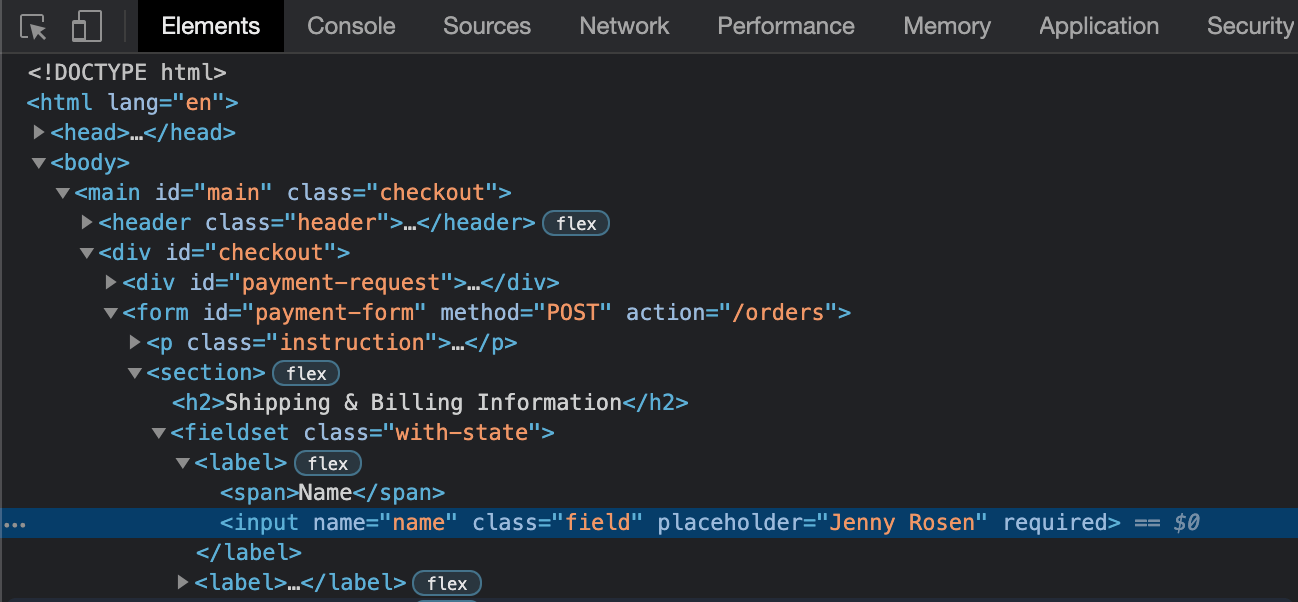
Inspect the "Name" form field with the browser developer tools
Inspect the HTML markup for the "Name" form field using the developer tools in the browser the robot opened (right-click the form and select Inspect, then right-click again on the "Name" element, and select Inspect):
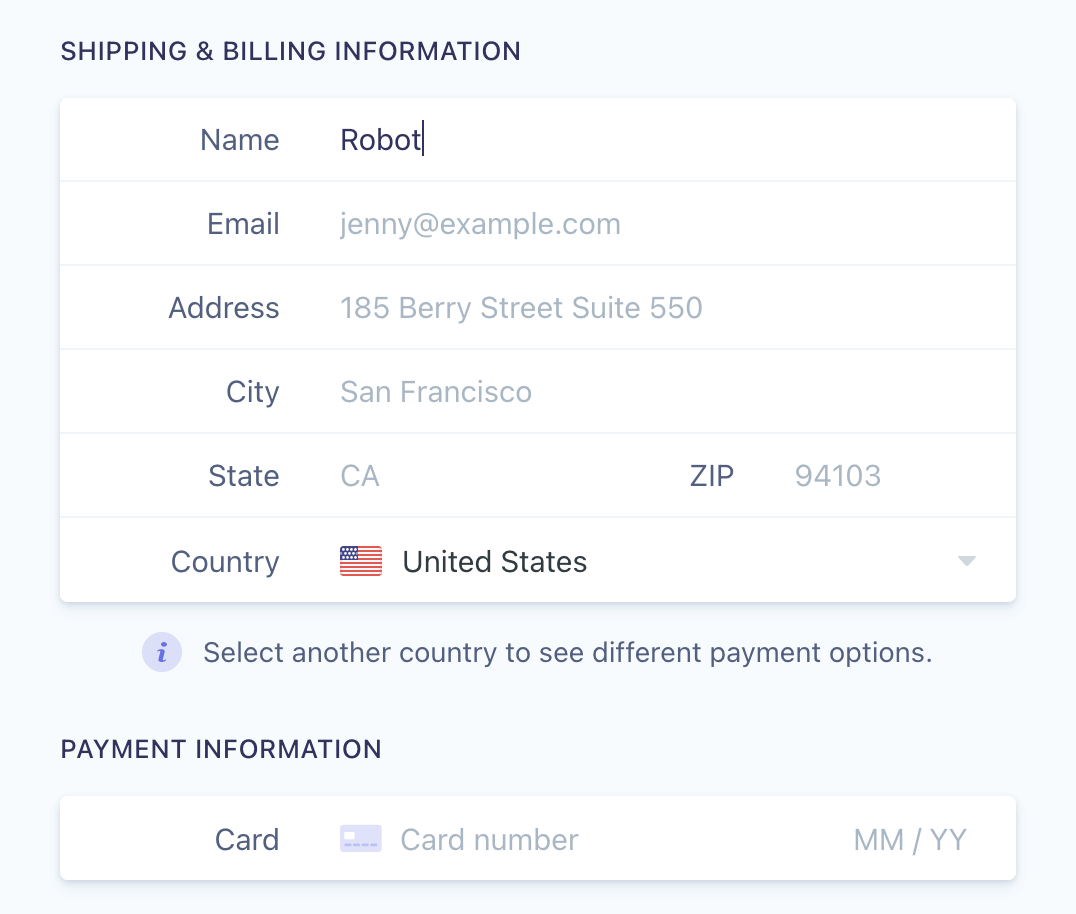
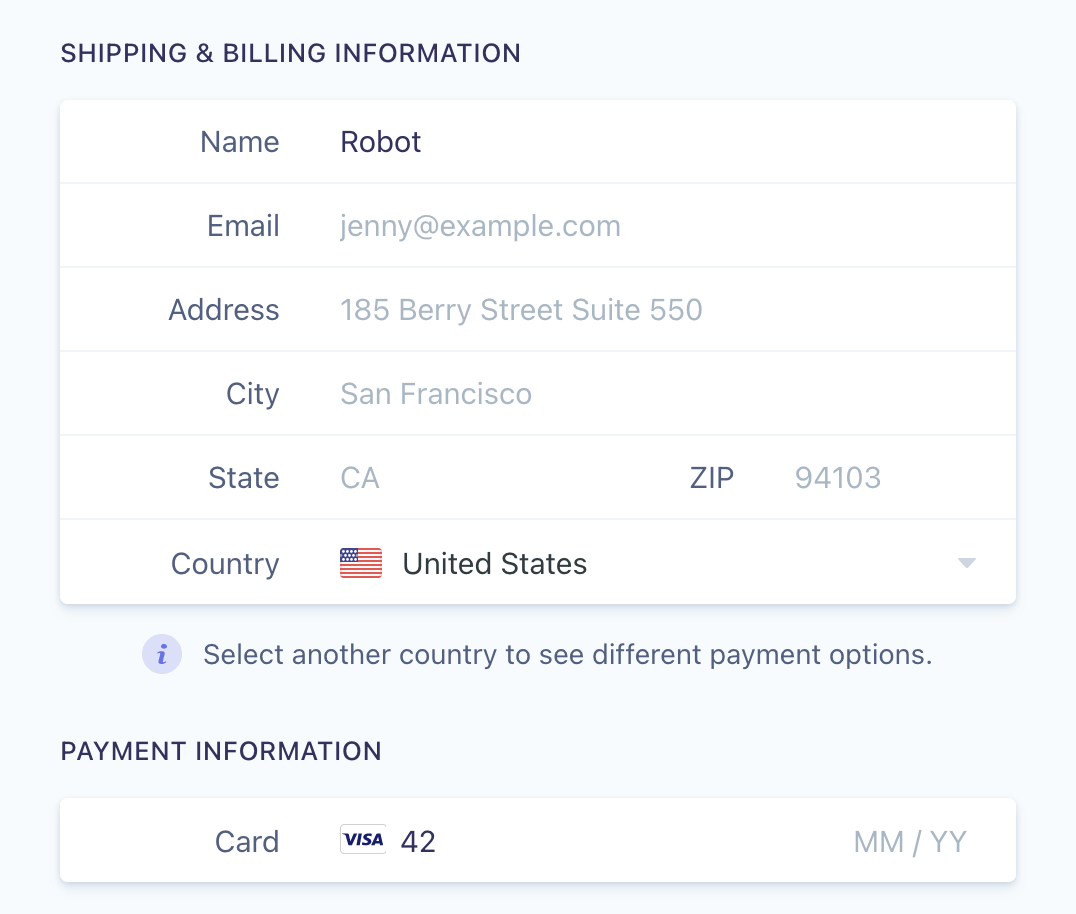
Use the Type Text keyword to type in the name
Type the following keyword call in the debug console and press Enter:
The robot will type in Robot in the "Name" form field:
Inspect the "Card" field with the browser developer tools
Inspect the HTML markup for the "Card" form field:
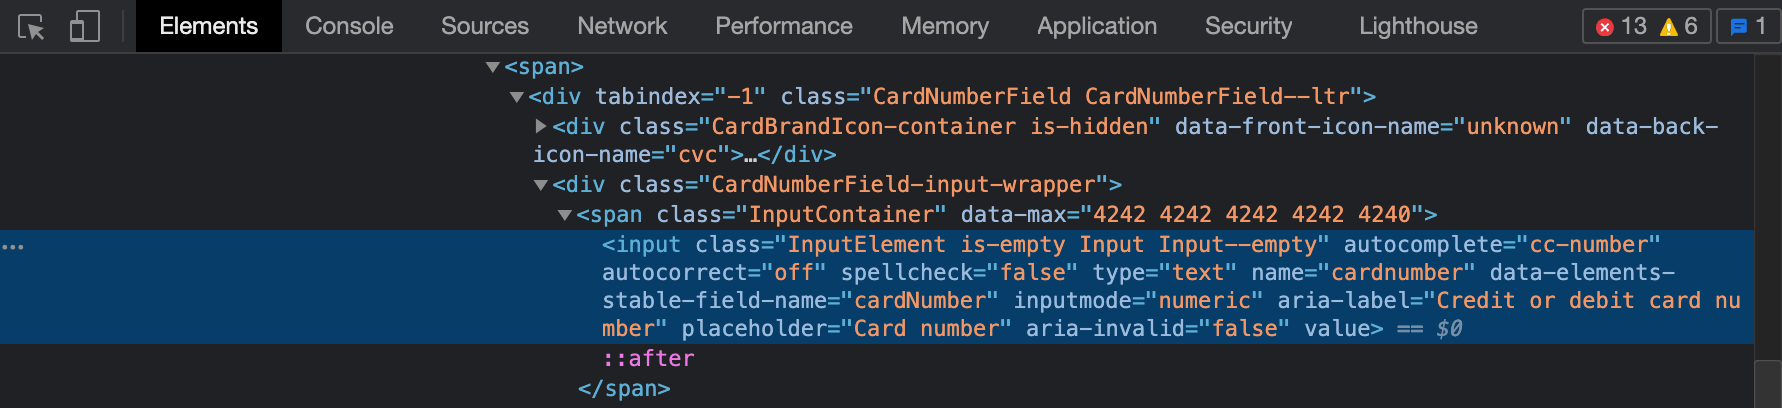
Use the Type Text keyword to type in the card number
Type the following keyword call in the debug console and press Enter:
The robot fails to type in the card number. Why is that? Scroll up the HTML markup, and you will notice that the card field is inside an iframe element:
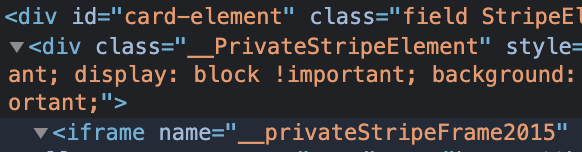
Type the following keyword call in the debug console and press Enter:
The css=#card-element iframe selector targets the iframe element. The >>> operator navigates inside the shadow DOM (inside the iframe). Finally the css=input[name="cardnumber"] selector targets the card number field:
Summary
The debugger tools in Visual Studio Code are useful when working with Playwright-based robots. Happy coding!